In 2023, the mobile gaming industry saw significant developments in user acquisition, with app developers spending a remarkable $29 billion to attract new players globally. According to AppsFlyer's latest report, "The State of Gaming App Marketing - 2024 Edition," the United States led this investment, accounting for over 40% of the total spend.
The report, drawing on anonymized data from 15,000 gaming apps, offers valuable insights into market trends, including platform-specific differences, evolving monetization strategies, and the most popular gaming genres by ad spend. In this article, we provide a comprehensive overview of the shifting dynamics in mobile gaming, guiding developers and marketers toward more effective strategies in the year ahead.
Over $29 Billion Spent on Mobile Gaming User Acquisition
UA Spending and Geographic Trends
A staggering $29 billion was allocated globally for user acquisition (UA) campaigns in 2023, marking a pivotal year for app developers and marketers alike. The United States emerged as the most competitive market, with $12.2 billion dedicated to acquiring new users, constituting over 40% of the global UA expenditure. In contrast, Japan and South Korea followed with $3 billion and $1.5 billion, respectively, underscoring the dominance of the U.S. in UA investment.
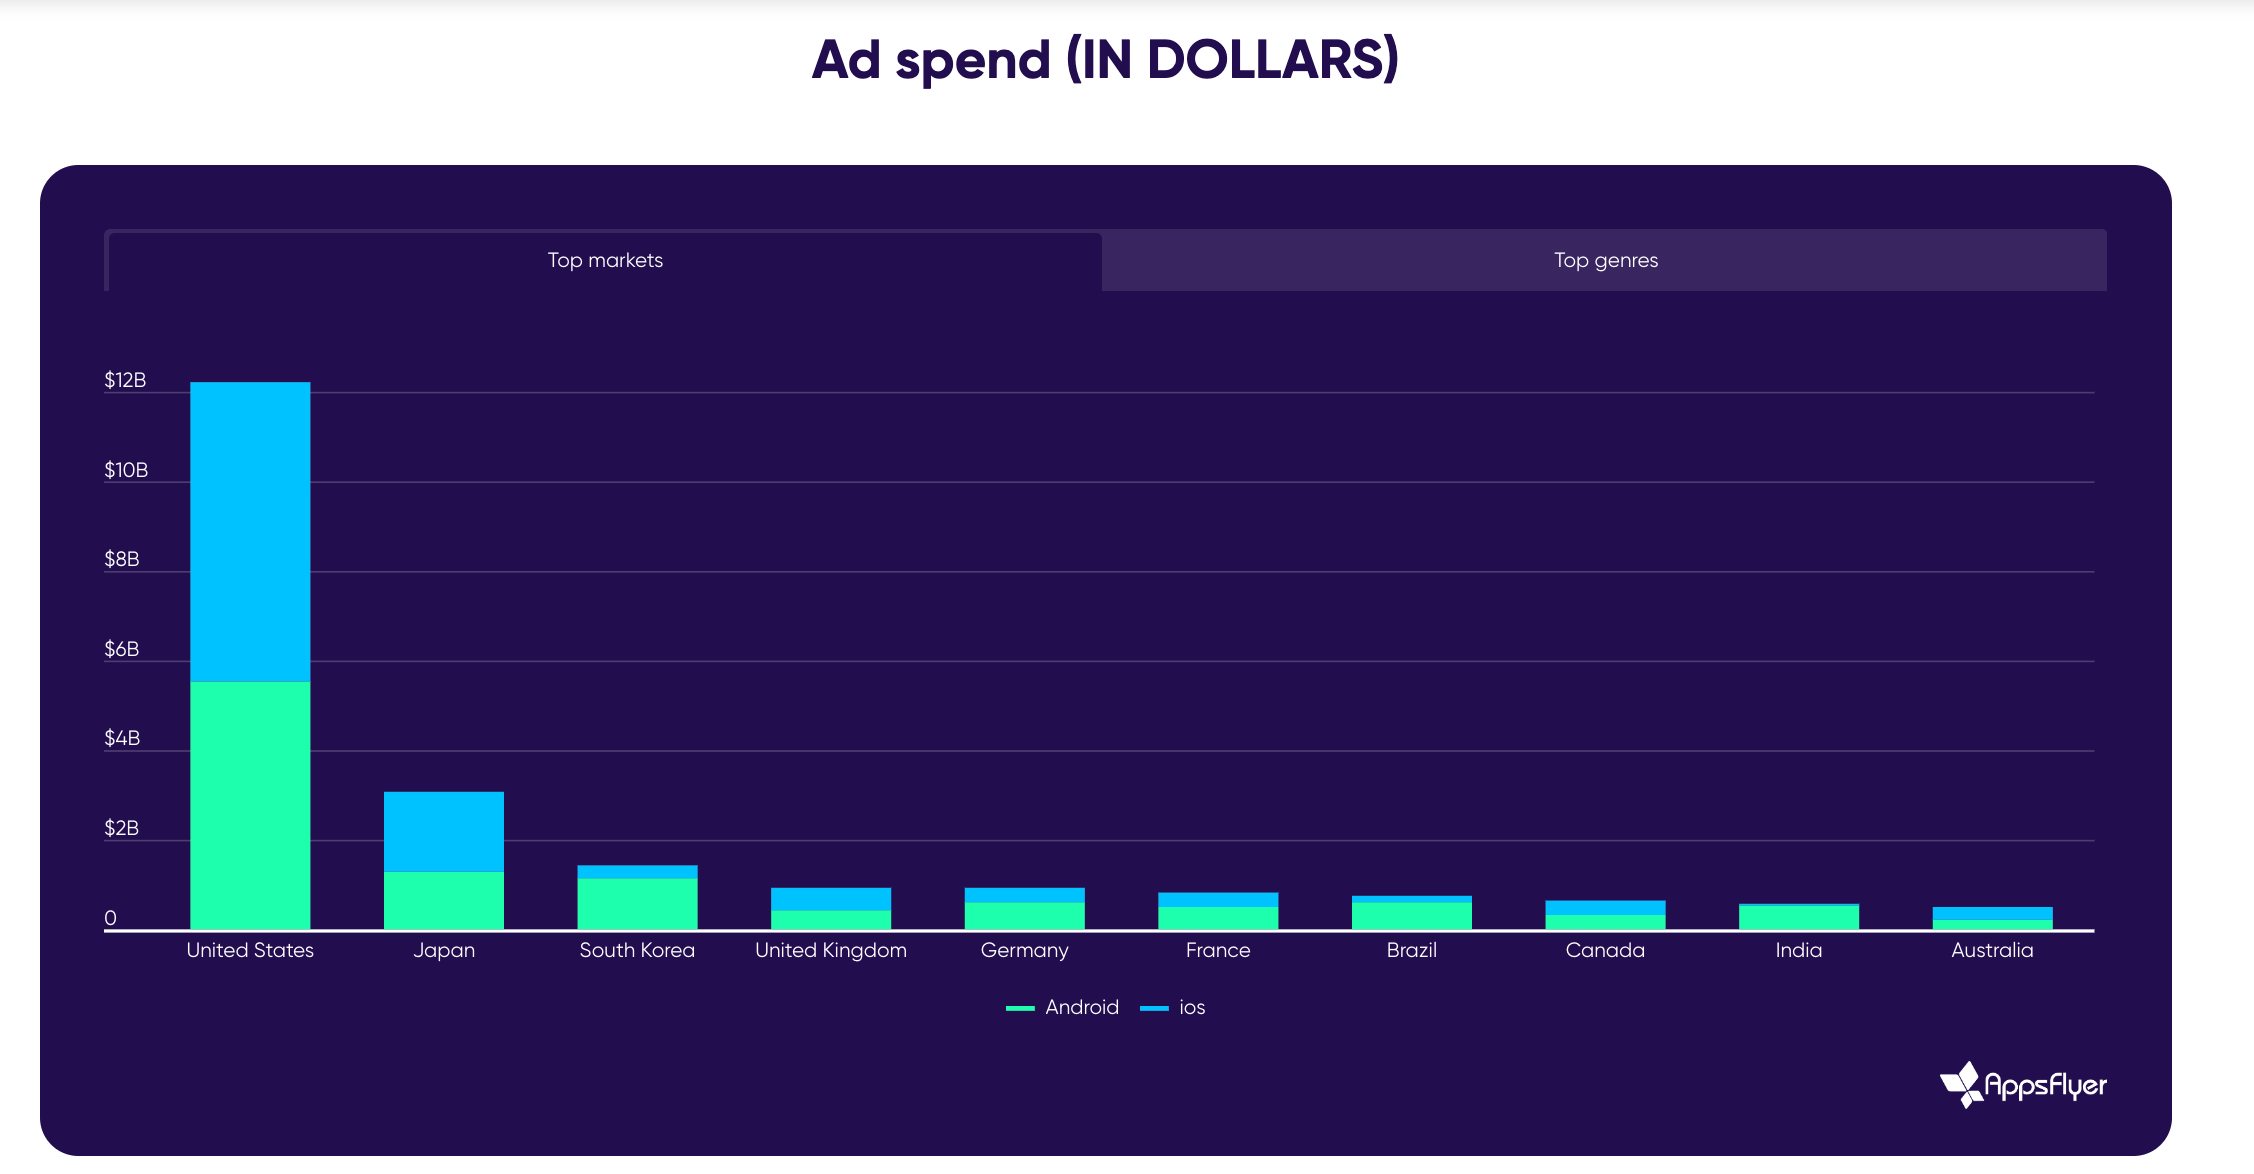
Ad Spend by Location
Top Gaming Genres by UA Spend
Genre preferences significantly influenced UA spending patterns. Match games led the charge with $8.65 billion spent globally, comprising approximately 30% of the total UA expenditure. This was followed by strategy games ($4.57 billion), RPGs ($3.84 billion), casino games ($2.72 billion), and simulation titles ($2.03 billion). Together, these genres accounted for a quarter of the total UA spending, highlighting developers' strategic focus on specific gaming categories.
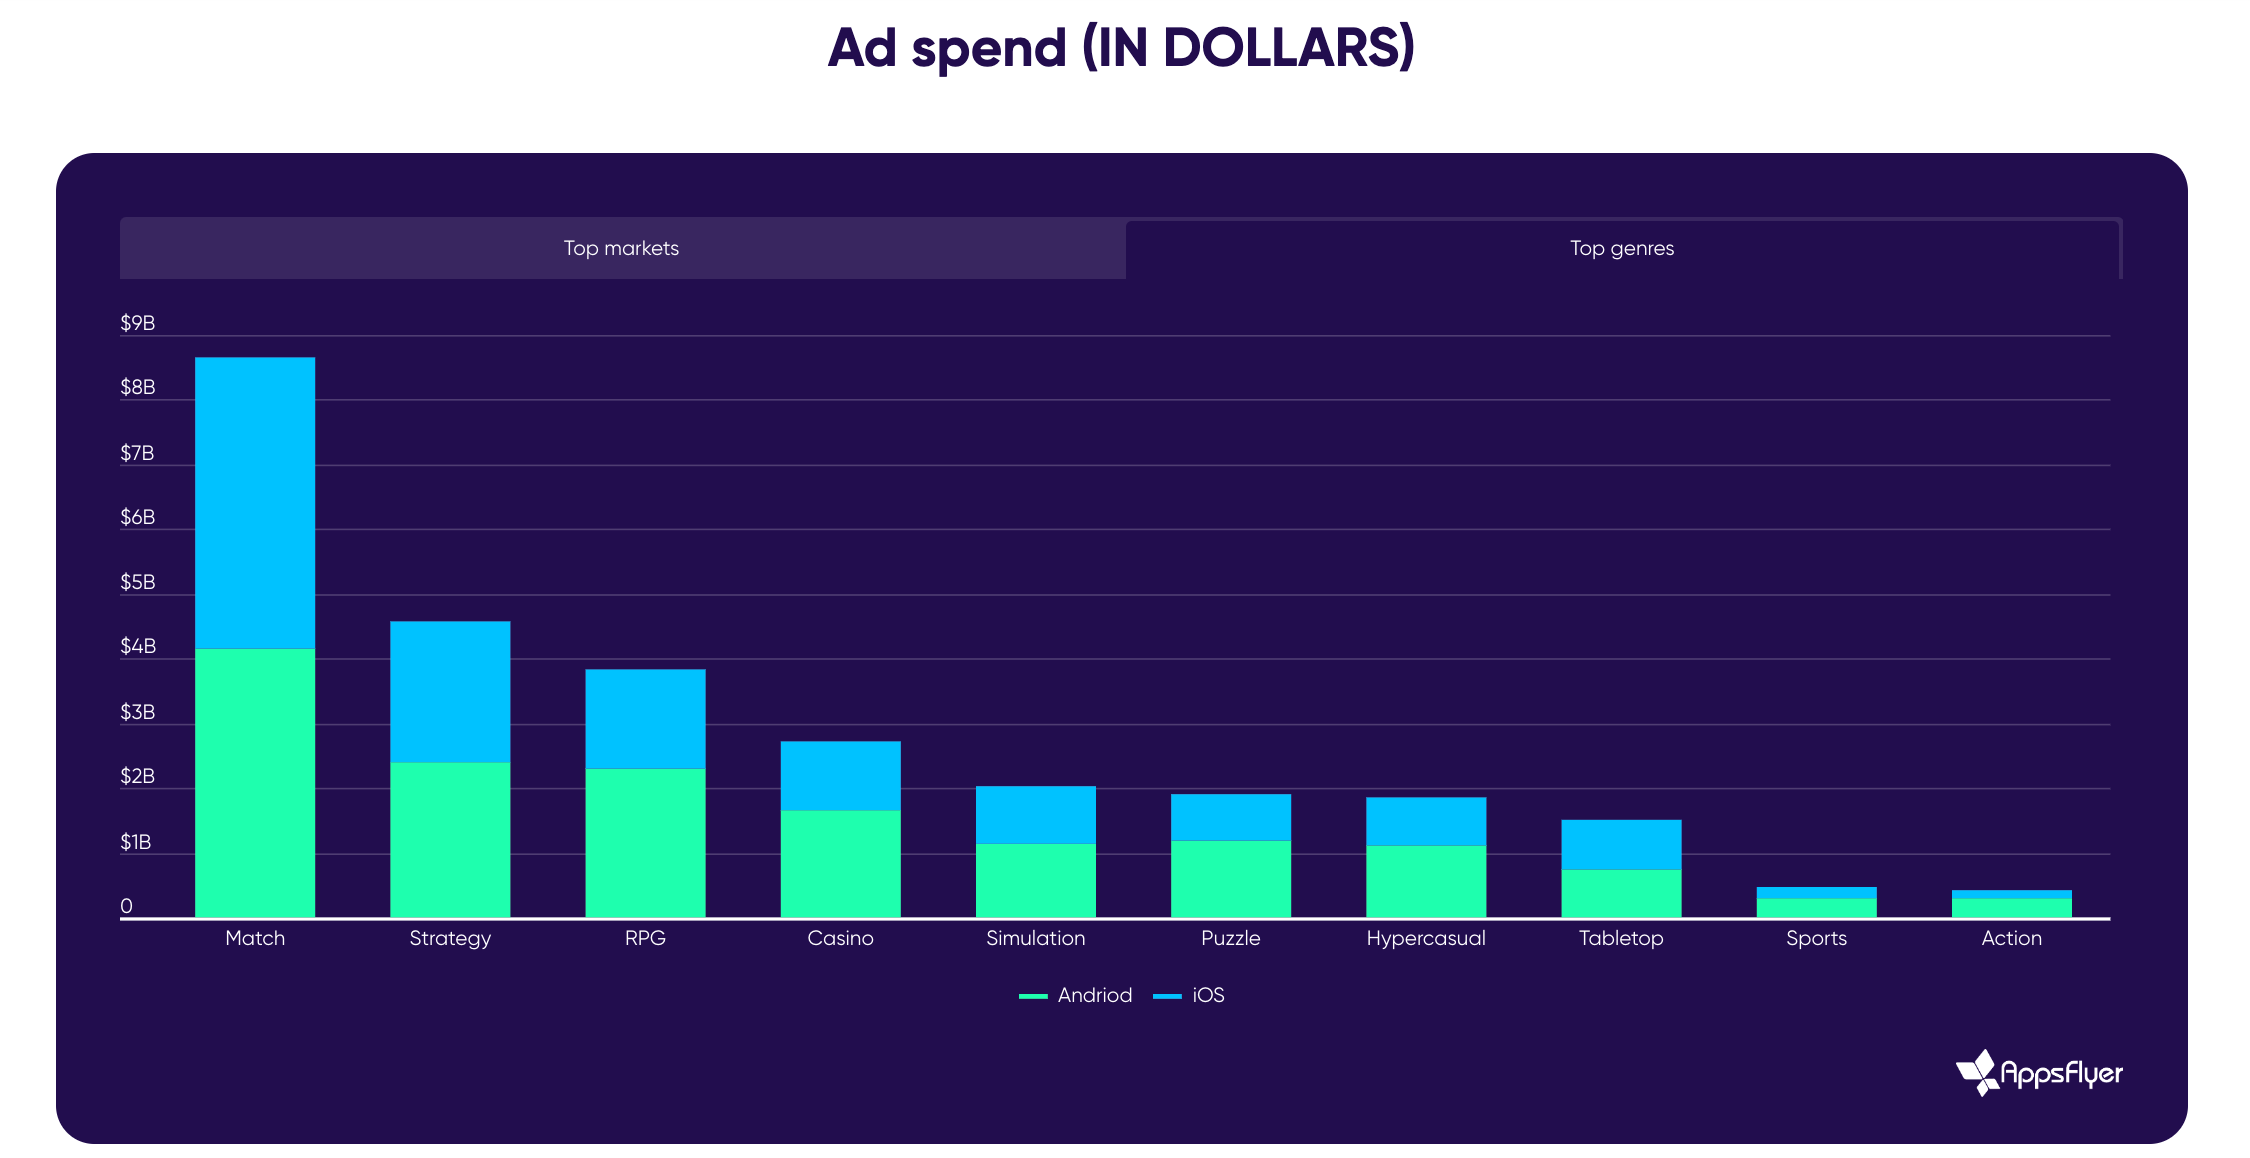
Ad Spend by Genre
Platform-Specific Insights: iOS vs. Android
AppsFlyer’s data revealed a convergence in Cost per Install (CPI) rates between iOS and Android platforms. While iOS retained a higher CPI at approximately $6.80, Android experienced a significant rise to $2.17, narrowing the historical gap between the two platforms. This shift indicates enhanced efficiency for developers targeting iOS users amid declining ad placement costs.
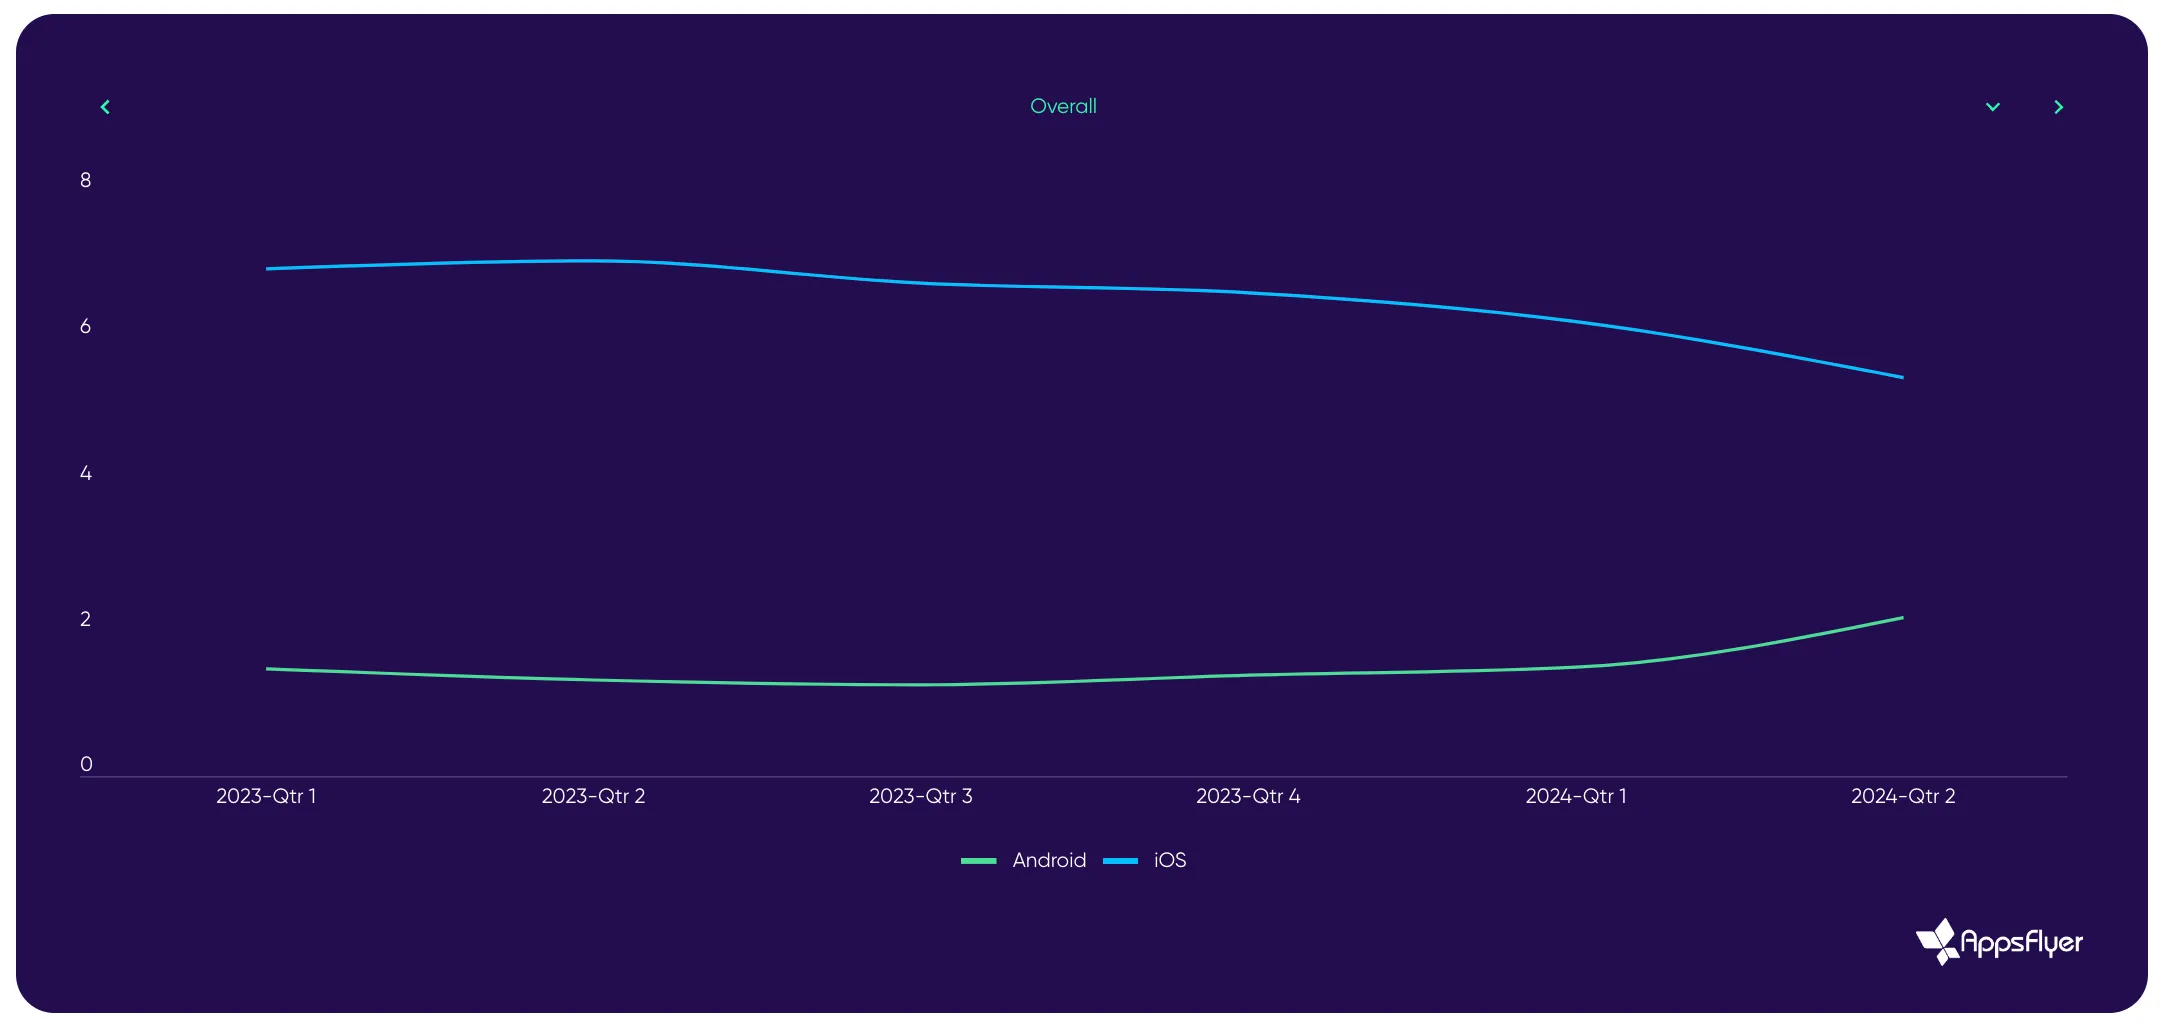
Ad Spend by Mobile Device: Android vs iOS
Evolution in Monetization Strategies
The report also highlighted evolving monetization strategies within the mobile gaming landscape. Traditionally distinct, hyper-casual, and mid-core games are increasingly adopting hybrid models combining in-app advertising (IAA) with in-app purchases (IAP). In 2023, 43% of games adopted hybrid models, up from 36% the previous year, reflecting a growing trend towards diversifying revenue streams.
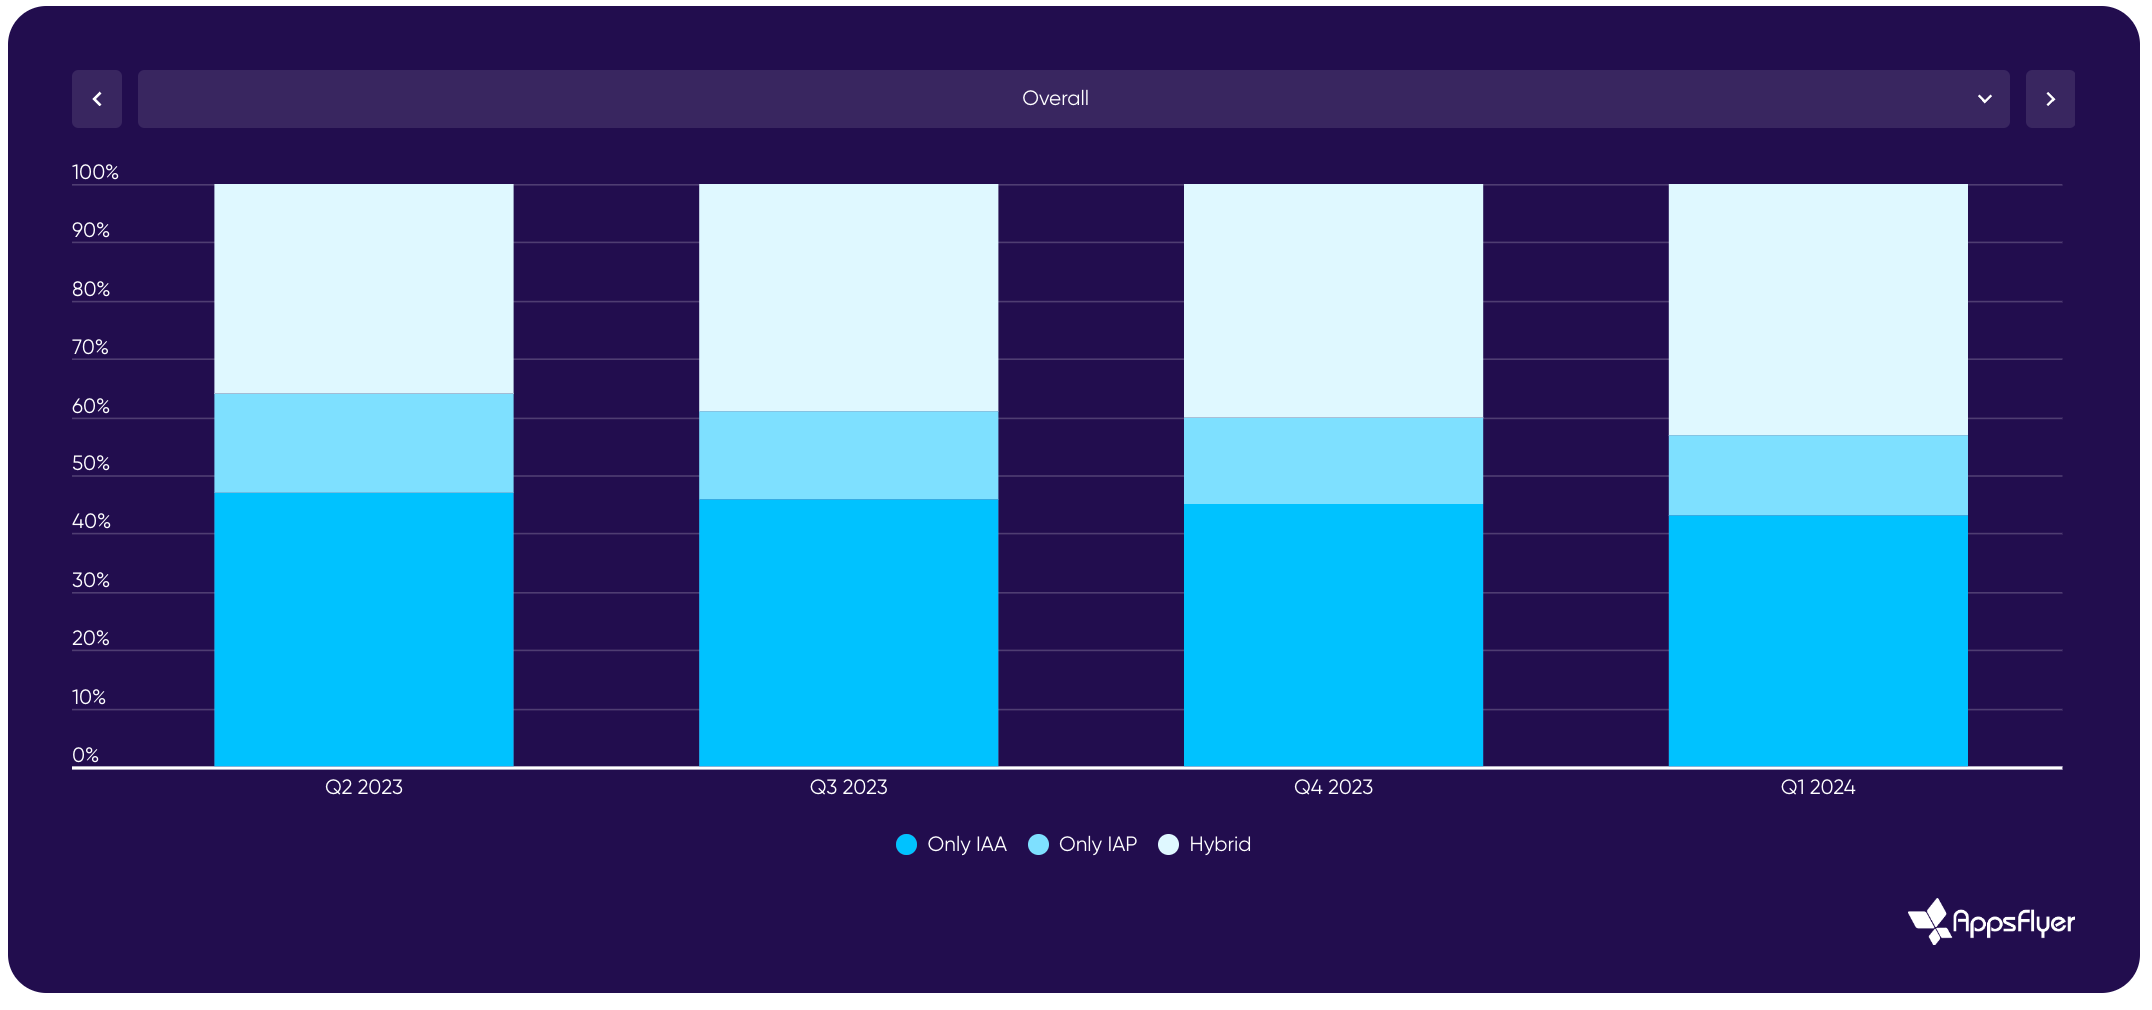
In-app Advertising (IAA) vs In-app Purchases (IAP) vs Hybrid Models
Early Monetization and Player Engagement
AppsFlyer emphasized the critical importance of early monetization efforts, noting that approximately 50% of lifetime payers make their first purchase within the first three days of gameplay. This underscores the significance of optimizing user engagement and conversion strategies in the initial stages of app usage.
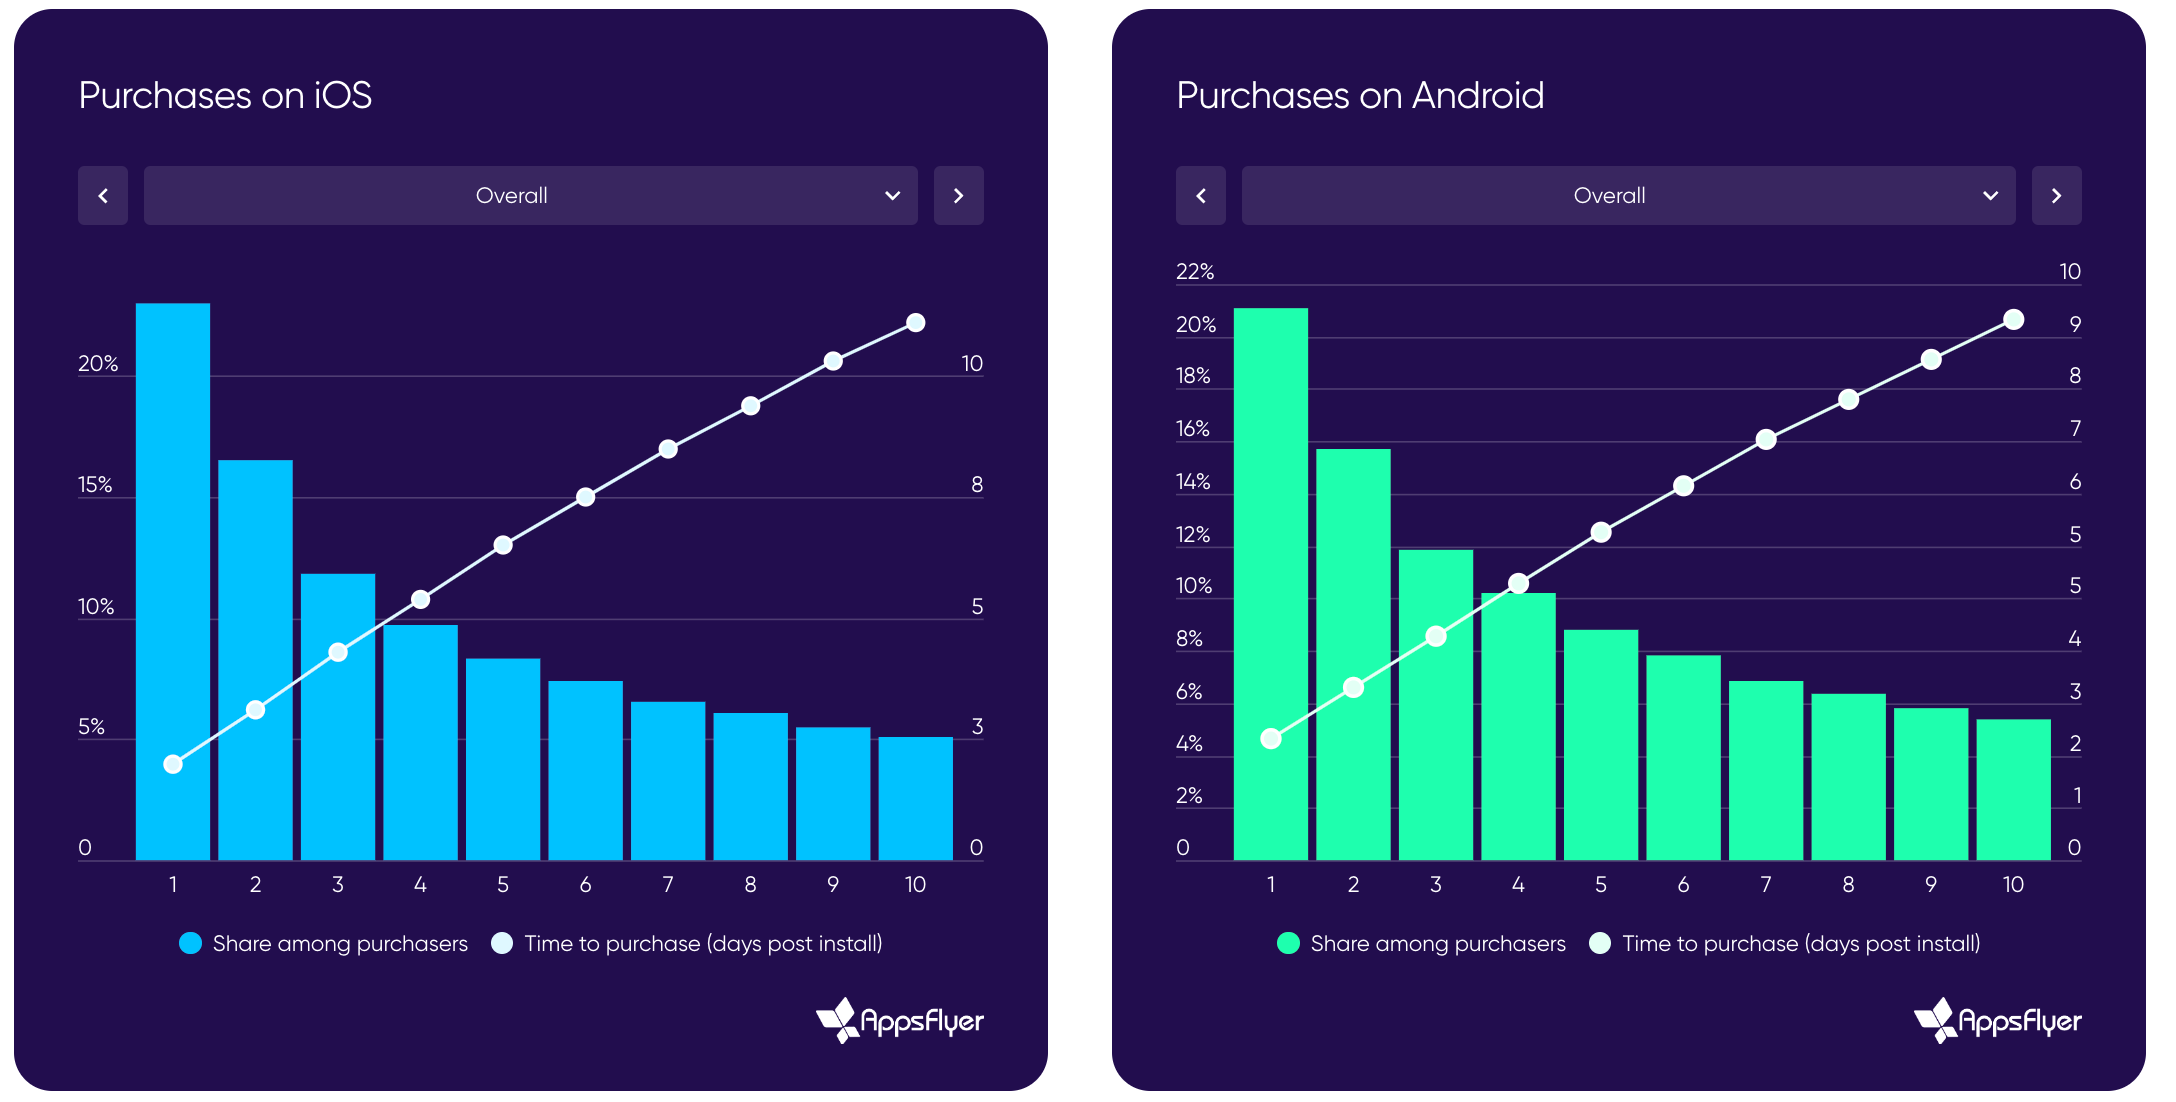
Purchases iOS vs Android
Final Thoughts
In summary, the 2023 landscape of mobile gaming user acquisition reveals a robust and evolving market characterized by significant investments and shifting strategies. The substantial $29 billion spent globally, with the U.S. dominating the expenditure, underscores the competitive nature of the industry. Insights from AppsFlyer's report highlight key trends, including the narrowing CPI gap between iOS and Android, the growing prevalence of hybrid monetization models, and the prominence of match games in ad spend.
As the mobile gaming sector continues to adapt, these findings equip developers and marketers with crucial knowledge to navigate the complexities of user acquisition and drive future success. For a deeper understanding of these trends and their implications, the full AppsFlyer report offers a detailed exploration.
Source: venturebeat.com